visx
At Airbnb, we made it a goal to unify our visualization stack across the company, and in the process we created a collection of novel visualization primitives for React, filling a major gap in available frontend visualization tooling.
What is visx?
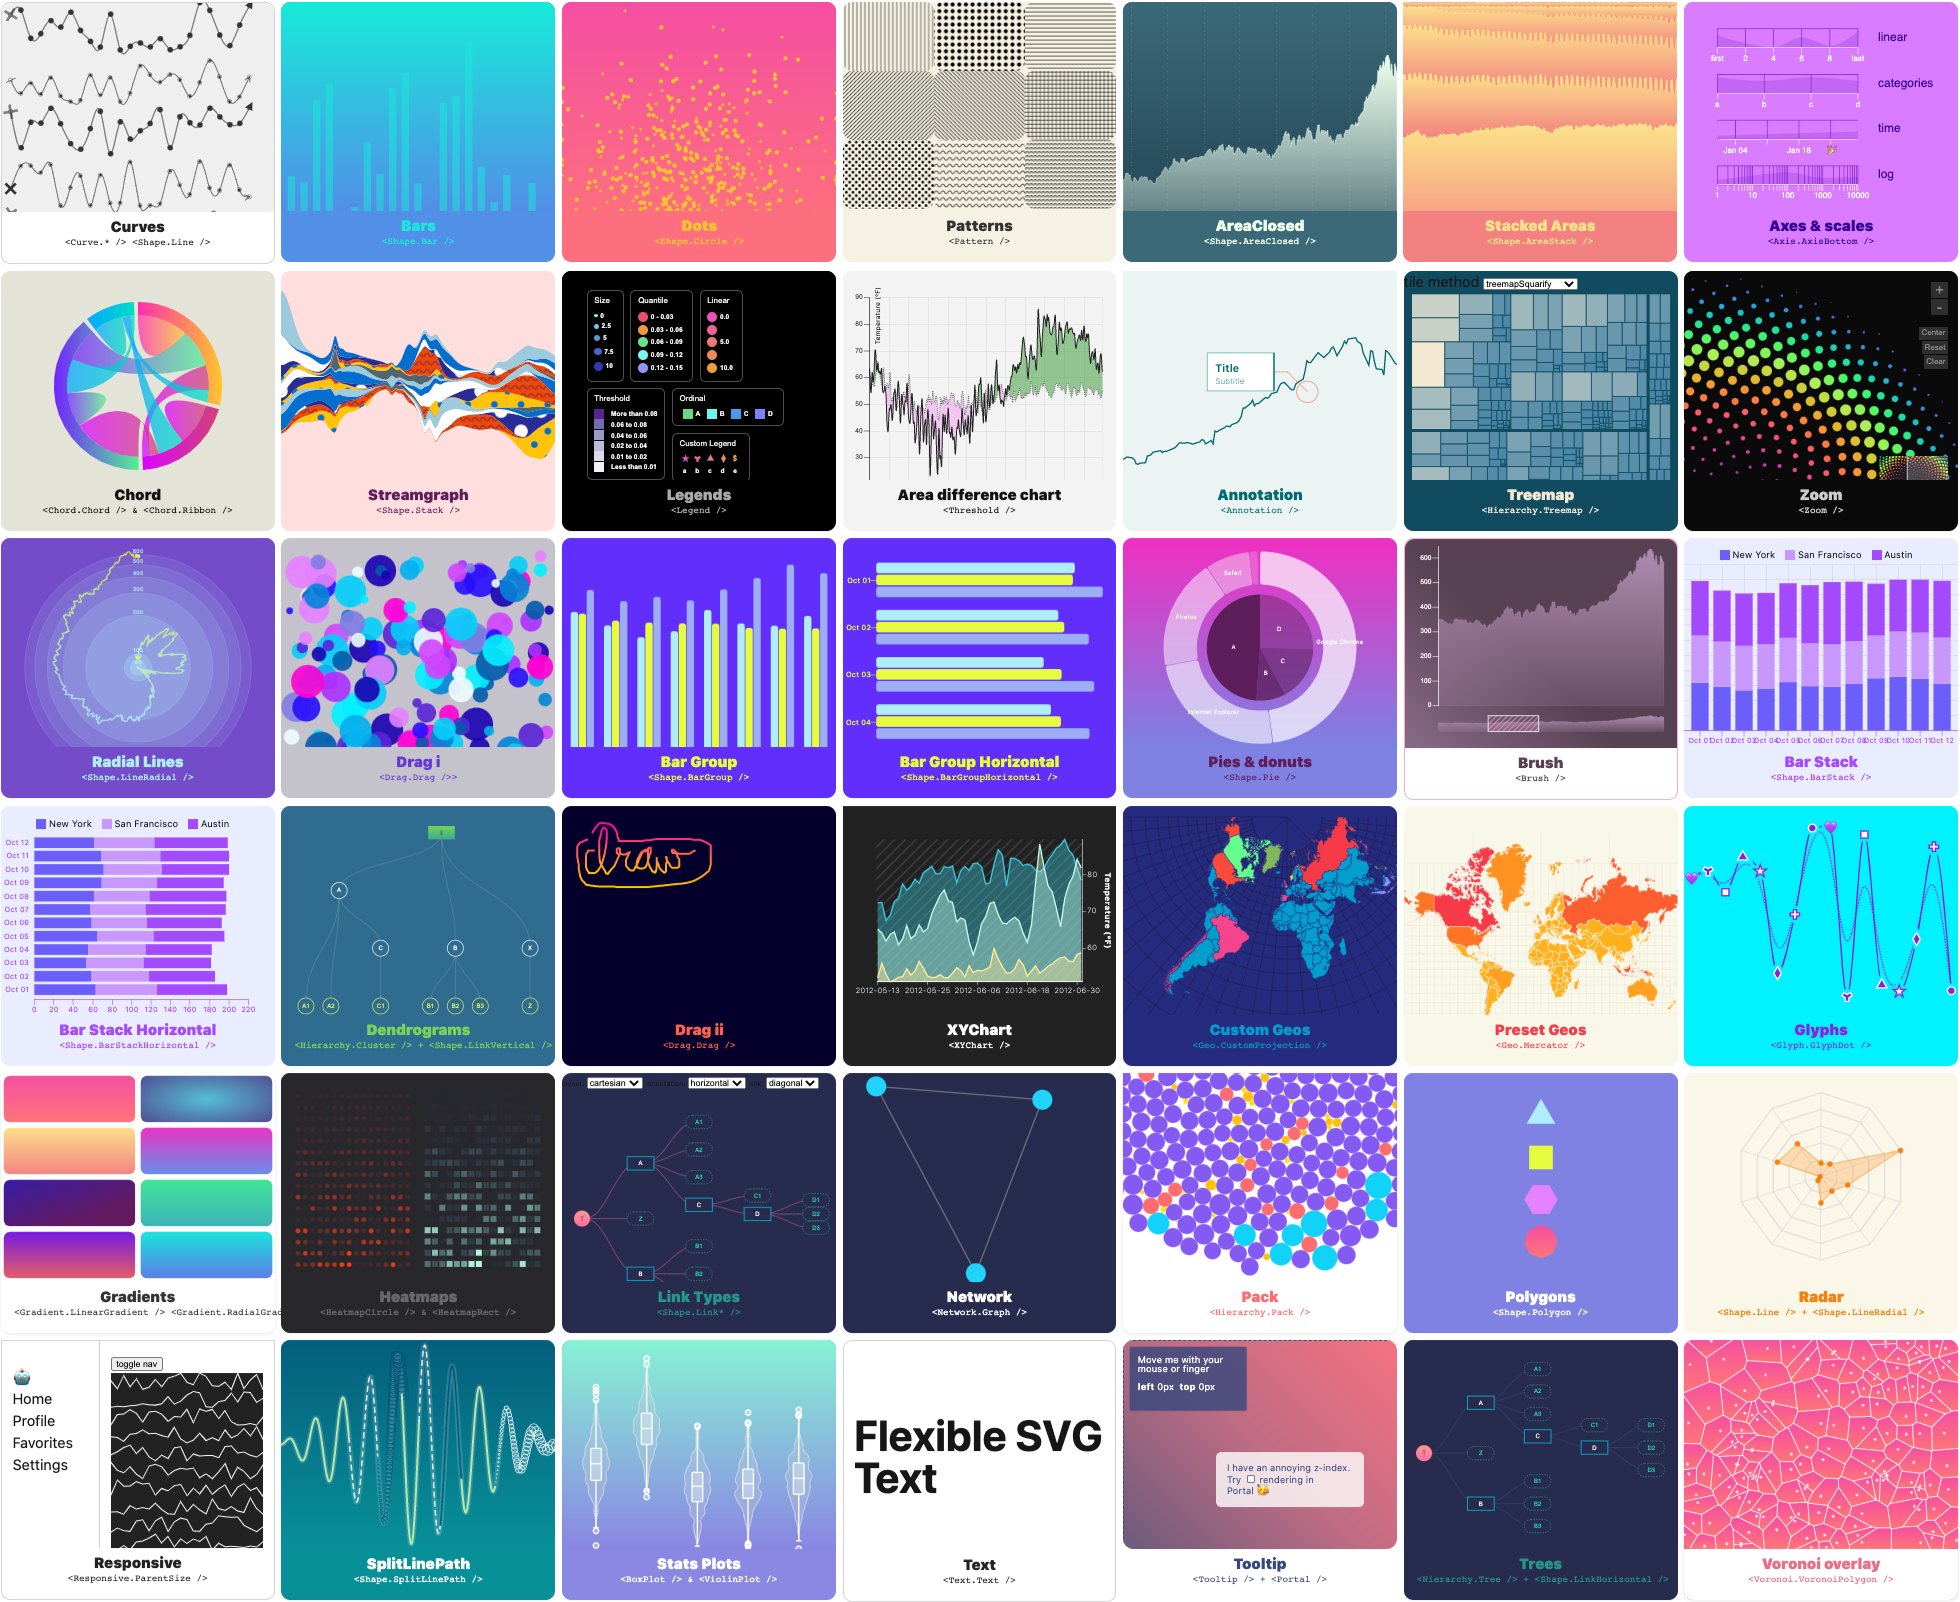
visx stands for visualization components, and is a suite of over 30 separate packages of React visualization primitives that fall into several categories. It is un-opinionated on state management, animation, and styling so it can integrate with any React codebase, and its emphasis on modularity (similar to D3) lets you keep your bundle sizes down by only using the packages you need to create your reusable chart library or a custom one-off chart.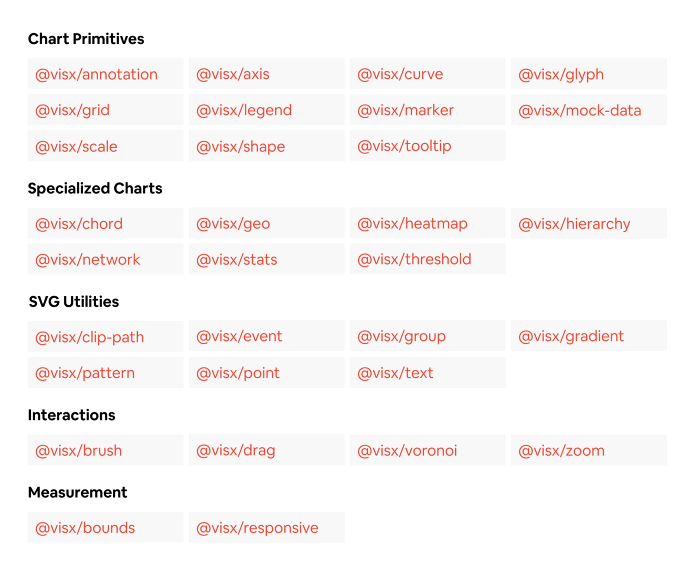
What makes visx unique?
There are dozens of libraries for creating visualizations for the web, but upon examining the problem space below, there was clearly an opportunity for a highly expressive React library to thrive. By creating low-level visualization primitives with a first-class React API, we hoped we could deliver learnability, expressiveness, and performance that any frontend developer could pick up.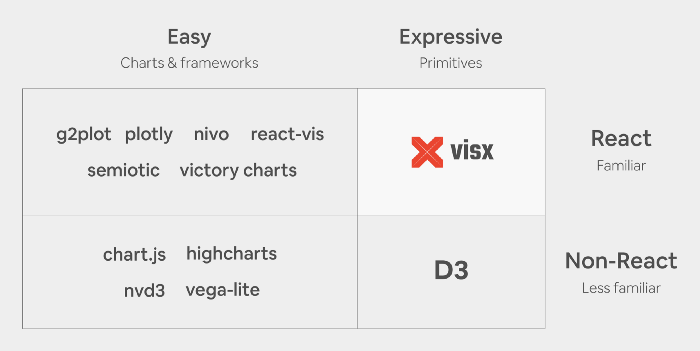
Want to read more?
Check out the full blog post on Medium